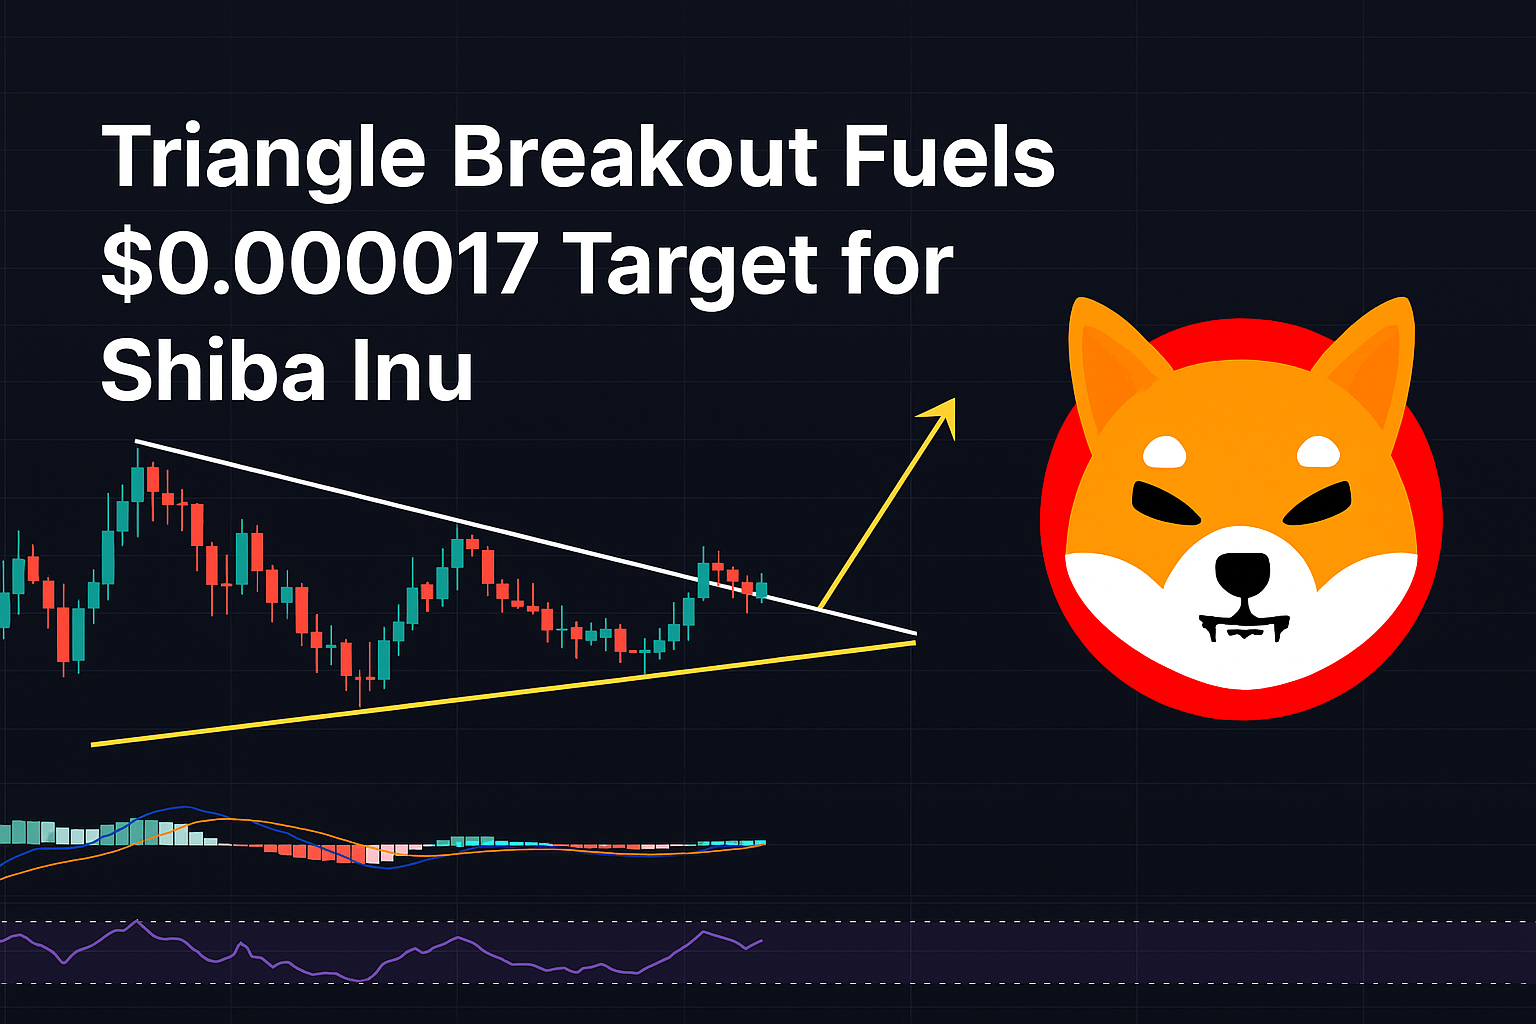
Shiba Inu Eyes Breakout Move
Shiba Inu (SHIB) has recently caught the attention of crypto traders, rallying over 4% in just 12 hours. This surge comes as the token forms a descending triangle pattern—often seen as a precursor to significant price movements. As SHIB approaches the $0.000015 mark, the big question on everyone’s mind is: Will it break above $0.000017, or will the current momentum fizzle out, leading to a pullback?
Let’s break down the technical setup, price indicators, and potential scenarios that could shape SHIB’s next move.
Technical Pattern in Play
Currently, SHIB is trading within the confines of a descending triangle on the 4-hour chart. This pattern typically indicates a bearish bias, but a breakout above the resistance trendline can flip the narrative in favor of the bulls. The base of the triangle sits at a solid support level of $0.00001393—a key area where buyers have consistently stepped in.
The upper boundary of the triangle is marked by a descending trendline, drawn from the May 12 high of $0.00001764 down to the lower high of $0.00001605 seen on May 23. This line now acts as overhead resistance, capping upward moves and pressuring the price to consolidate.
SHIB’s recent bounce off the support line, resulting in a near 4% rise, suggests renewed buying interest. This price action positions SHIB at a critical juncture—either it will test and potentially break through the descending resistance, or it could fail and revisit key support zones.
Indicators Signal Bullish Shift
Several momentum indicators are beginning to tilt in favor of the bulls, supporting the idea of a potential breakout. The MACD (Moving Average Convergence Divergence) has recently shown a bullish crossover. Both the MACD line and the signal line are trending upwards and inching closer to the centerline, a move that often precedes sustained upward momentum.
At the same time, the Relative Strength Index (RSI) has climbed above the 50-point midpoint. This indicates strengthening buying pressure, giving bulls more confidence as they challenge resistance levels.
Adding to the bullish case, Fibonacci retracement levels are offering some valuable insight. SHIB is approaching the 50% Fibonacci level at $0.00001551—a key resistance that, if broken, could open the door for a rally toward the $0.000017 zone. This level also aligns closely with the 100% Fibonacci extension, offering a logical target for a potential breakout move.
Breakout or Breakdown Ahead?
The current price action and indicators suggest SHIB may be preparing for an upward breakout. If bulls can push the price decisively above the descending triangle’s resistance, the next target is the recent peak at $0.00001708. Beyond that, a move toward the May 12 high of $0.00001764 isn’t out of the question, particularly if broader market sentiment remains positive.
However, the possibility of a failed breakout should not be ignored. If SHIB gets rejected at the trendline and loses momentum, the price could slip back toward the key support at $0.00001393. A breach of this level would invalidate the bullish triangle setup and open the door for a deeper correction. In that case, the next major support lies at $0.00001230—the low observed on May 6.
Final Thoughts on SHIB’s Path
Shiba Inu is at a pivotal moment. The current descending triangle formation paints a picture of market indecision, but one that’s leaning bullish thanks to strong technical signals and improving momentum indicators.
For traders and investors, the key levels to watch are $0.00001551 (50% Fibonacci resistance), $0.00001708 (immediate breakout target), and $0.00001393 (critical support). A confirmed breakout above the triangle could trigger a strong rally, while a failure to do so might lead to a retest of lower levels.
As always in crypto, volatility can swing the market in either direction. But right now, the charts are hinting that Shiba Inu could be gearing up for a breakout moment that sends it firmly back into bullish territory.

