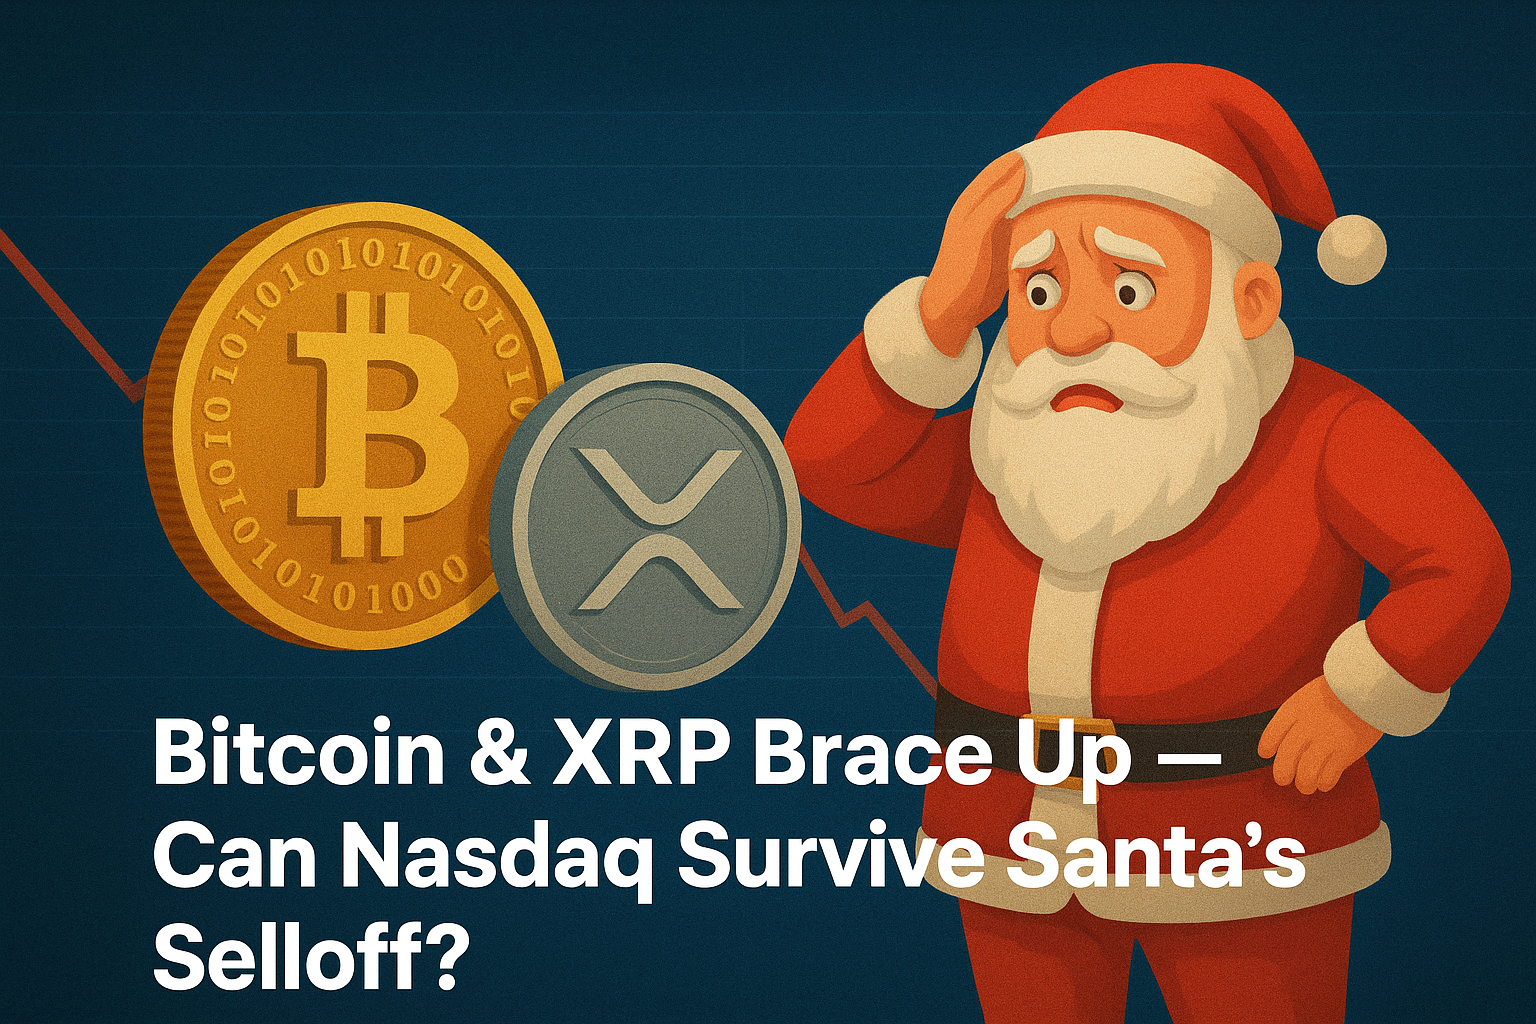
The final weeks of the year are proving anything but calm for risk assets. XRP, Bitcoin, and the Nasdaq Index are all trading at crucial technical levels that may define market momentum heading into early 2026. With volatility rising and historical patterns flashing warnings, traders are watching closely for breakout—or breakdown—signals.
This analysis draws from insights shared by CoinDesk’s Chartered Market Technician Omkar Godbole, who highlights how crypto’s leading assets are pressing against make-or-break zones at the same time U.S. equities are showing exhaustion signals. A confluence like this is rarely accidental—and often a precursor to a major shift.
XRP Nears Critical Support
Payments-focused cryptocurrency XRP, currently hovering near $2.02, has dropped more than 6% this week, dragging the token back to its long-standing support at $2.00—a crucial level that has shaped its price structure since late 2023.
This $2 support zone has repeatedly acted as a bear fatigue point, reflected through long lower wicks on weekly candles. Sellers routinely push prices down, only for buyers to scoop up liquidity, preventing deeper losses. But this time, the stakes are higher. If the level breaks decisively, XRP holders may capitulate, triggering a broader slide.
Key technical takeaway:
- Break below $2.00 → accelerated downside likely.
- Hold above $2.00 → stabilization, but bulls must prove strength.
For a bullish reversal, XRP must reclaim the descending trendline connecting lower highs since July—now near $2.50. A breakout above that line would signal renewed momentum and invalidate the near-term bearish structure.
Bitcoin Balances at Three Supports
If XRP is walking on thin ice, Bitcoin may be standing on a frozen lake. BTC, currently around $87,000, trades near a powerful cluster of supports—arguably one of the strongest confluences of the past several years.
The triad includes:
- Long-term bullish trendline connecting higher lows from 2023–2024
- 100-week Simple Moving Average (SMA)
- 38.2% Fibonacci retracement from the 2022 market bottom to the 2025 all-time high above $126,000
Break all three, and the market shifts decisively. A rollover from this zone opens the doors to April’s swing low at $74,500, followed by a deeper retest near the 2021 all-time high (~$69,000).
Some traders are even positioning early for sub-$80k Bitcoin as 2026 begins, anticipating volatility in the absence of clear macro catalysts.
For BTC bulls, the path upward is clear but not easy. Momentum returns only if Bitcoin reclaims the 50-week SMA, sitting just above $102,252. A move above that level would likely revive confidence in the long-term uptrend.
Nasdaq’s Hanging Man Warning
While crypto battles support tests, the equity world isn’t offering much relief. The Nasdaq Composite just posted a classic hanging man candlestick on the monthly chart, signaling potential weakness at record highs.
A hanging man pattern forms when:
- The candle has a small real body near the top
- A long lower shadow, at least twice the body’s length
- Little or no upper shadow
This pattern reveals that sellers entered aggressively during the month but buyers barely managed to pull the index back up. When this forms at all-time highs, it often warns of a top, a trend pause, or even the start of a broader reversal.
Given the well-documented correlation between Bitcoin and tech stocks, a Nasdaq downturn could easily spill into crypto, especially if liquidity dries up or risk appetite fades.
Will the Santa Rally Fail This Year?
The seasonal Santa rally—a year-end surge that typically lifts risk assets—may be in jeopardy. With:
- XRP testing major support,
- Bitcoin hovering near a critical confluence, and
- Nasdaq signaling exhaustion,
the market could be setting up for a more muted or even bearish holiday period.
Instead of a smooth upward drift into December, charts across crypto and equities suggest that caution—not celebration—may be the dominant theme this year. Traders will likely look for confirmation candles, trendline breaks, and volume shifts before committing strongly to directional bets.
If support zones hold, the Santa rally could still spark a quick relief bounce. But if they fail, it could mark the beginning of a materially different landscape heading into early 2026.