Bitcoin Pulls Back After ATH
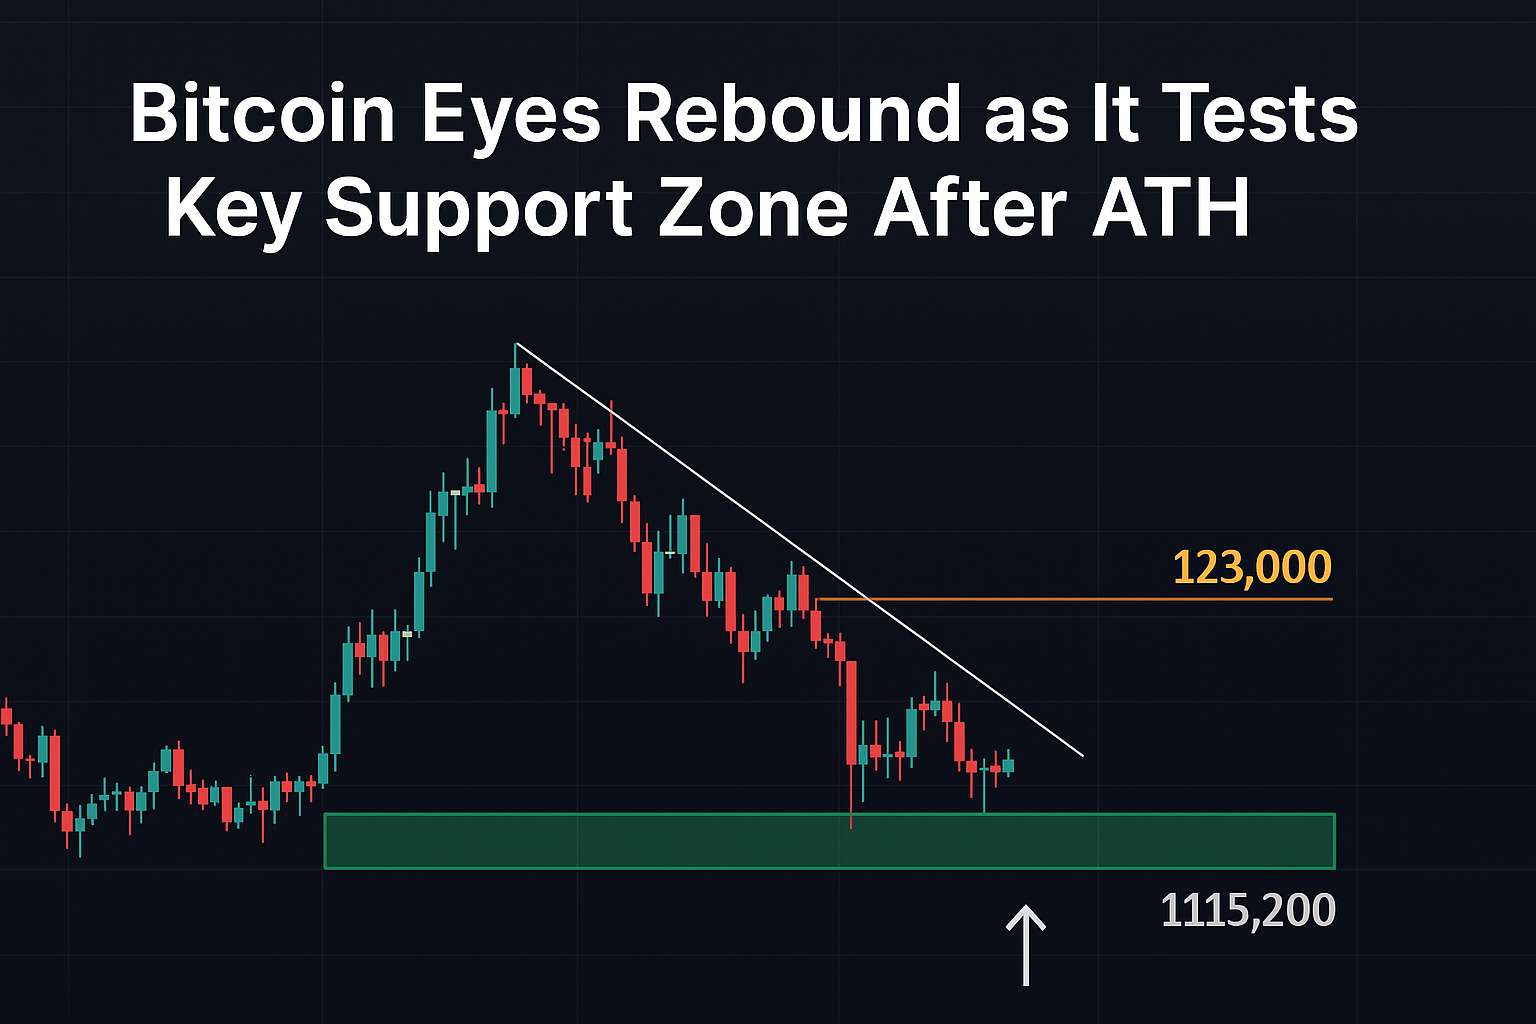
Bitcoin recently reached a new all-time high (ATH) around $123,000, signaling continued long-term bullish momentum. However, as is often the case after parabolic price expansions, the market has entered a corrective phase. This pullback is not necessarily a sign of weakness—it may represent a healthy consolidation within a broader uptrend.
After peaking, Bitcoin retraced into a critical technical zone, now acting as a potential launchpad for a fresh move higher. The correction has brought price into a region where several powerful indicators—namely, the Value Area Low, Volume-Weighted Average Price (VWAP), and 0.618 Fibonacci retracement—all converge. This confluence of support significantly increases the probability of a bullish reaction.
Technical corrections following new ATHs are common, especially in trending markets. What matters most is whether these corrections break key structures—or respect them. So far, Bitcoin appears to be respecting its broader range and structure.
Confluence of Support Signals Strength
The current support region around $115,200 is more than just psychological—it’s a point of high technical confluence. Let’s break down the major technical levels reinforcing this zone:
- Value Area Low – This represents the lower boundary of the most traded price range over a specific period. Price returning to this level after losing the Value Area High completes what’s called a full market auction rotation. This is a strong structural pattern in range-bound markets.
- Anchored VWAP Support – The Volume-Weighted Average Price (VWAP) provides insight into the average price at which the majority of volume has occurred. When anchored from the last impulse move, it aligns with current price action—further validating the area as strong support.
- 0.618 Fibonacci Retracement – Often called the “golden pocket,” this Fibonacci level is one of the most respected technical retracement zones. Bitcoin’s pullback into this level suggests the move is a retracement rather than a trend reversal.
These overlapping indicators build a case for this support zone acting as a rebound base. If bulls hold the line here, Bitcoin may quickly reclaim lost ground.
Range Intact Despite Correction
Despite the recent dip, Bitcoin’s market structure remains intact. In fact, the correction appears to be a market rotation within a defined trading range rather than the start of a broader downtrend.
Bitcoin’s price action has followed a textbook pattern:
- Price surged to a new ATH around $123,000
- It then failed to hold the Value Area High
- Subsequently, it rotated downward to the Value Area Low near $115,200
This is a classic auction market behavior, suggesting the market is cycling within a consolidation phase. Rather than viewing this as bearish, traders see it as an opportunity. If the range low holds, a return to the range high—and a potential breakout—could follow.
Moreover, this high-timeframe structure provides a well-defined invalidation level. If price breaks below the $115,200 support, it would signal that the current trading range has failed. This opens the door to deeper downside targets. But until then, bulls remain in control.
What Comes Next For Bitcoin
So what should traders and investors watch for in the coming days?
- Support at $115,200 Must Hold:
This is the most critical level in the current structure. As long as price remains above this, the range is valid, and bulls have a strong case for a bounce.
- Reclaim of Mid-Range and VWAP:
After defending support, bulls will aim to push price back above the VWAP and mid-range levels. These act as short-term resistance and can flip sentiment bullish if reclaimed. - Retest of $123,000 Resistance:
If momentum builds, Bitcoin could quickly rotate back toward its previous high. A successful retest or breakout would put price discovery back on the table. - Failure to Hold Support:
If price loses the $115,200 level with volume and confirmation, the next likely support lies between $108,000 – $110,000, which would represent a more serious correction. - Macro Trends Still Favor Bulls:
Despite the pullback, Bitcoin continues to benefit from macro drivers: institutional demand, ETF inflows, and a favorable regulatory outlook. These factors make deeper corrections buy-the-dip opportunities for long-term participants.
Final Thoughts on the Pullback
This recent correction, while sharp, is not abnormal. In fact, it may represent the necessary reset needed for the next leg higher. Bitcoin’s rally to $123,000 was fast and aggressive, and consolidations like this often serve to shake out weak hands and re-accumulate strength before resuming the uptrend.
The presence of multiple technical support signals adds weight to the idea that this is just a range-based correction. As long as $115,200 holds firm, bulls are likely to remain in control. A rebound here could set the stage for another breakout—possibly to new all-time highs beyond $123,000.
However, caution is warranted. If the support zone breaks decisively, the bullish thesis will be invalidated, and traders should prepare for deeper price exploration. For now, all eyes are on the range low—and whether it becomes the springboard for Bitcoin’s next move.